
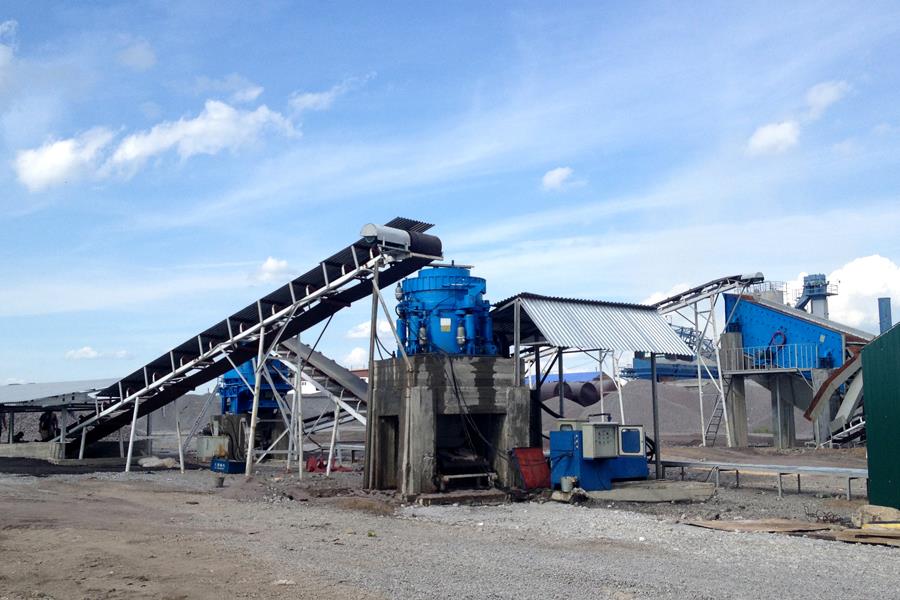
US Aggregate Production Rebounds After Six Quarters as Crushed Stone Jumps 7%
The Slide Ends, and the Numbers Behind the Turn
The US Geological Survey‘s latest quarterly estimates show nationwide aggregate output rose 5 percent in the third quarter, the first increase after six consecutive quarters of decline. Crushed stone did the heavy lifting, climbing 7 percent year over year, while construction sand and gravel edged up 0.7 percent. Total production for the quarter reached approximately 703 million metric tons.
That figure matters less for what it says about one quarter than for what it says about direction. Six consecutive quarters of contraction had pushed aggregate producers into a defensive posture — deferring equipment purchases, stretching maintenance intervals, and running existing plants harder. A single quarter of growth does not reverse that, but it changes the conversation. Producers who spent the past eighteen months postponing capital decisions are now looking at whether their crushing circuits can actually deliver the throughput that a recovering market will demand.
Crushed Stone Leads, and the Reason Is Not Complicated
The 7 percent increase in crushed stone shipments is the headline number, and it is not a statistical blip. Crushed stone is the backbone of road construction and maintenance, and the Infrastructure Investment and Jobs Act has been funding highway and bridge projects at approximately $350 billion over five years. Those projects were awarded in waves, and the material demand they generate arrives on a delay — after engineering, permitting, and mobilisation, not immediately after the contract is signed.
What the Q3 data suggests is that a portion of that delayed demand is now reaching the quarry gate. Shipments increased in 33 of the 41 states for which estimates were made, which points to broad-based recovery rather than a handful of large projects distorting the national figure. The leading crushed stone states in the first half of 2026 were Texas, Pennsylvania, Missouri, Florida, and Ohio, together accounting for a substantial share of total output.
For a quarry operator, the implication is straightforward. If crushed stone demand is recovering, the primary and secondary crushing stages will be running closer to design capacity. A jaw crusher that was adequate at 70 percent utilisation may become a bottleneck at 85 percent. The wear parts that lasted through the slow period will wear faster. The maintenance schedule that was comfortable in a soft market becomes tight in a recovering one.
Sand and Gravel: A Different Picture With Different Drivers
Construction sand and gravel rose only 0.7 percent in Q3, a much more modest recovery than crushed stone. That divergence is not surprising. Sand and gravel demand is more closely tied to residential construction and local commercial development, while crushed stone is more exposed to public infrastructure spending. Residential construction has been slower to recover, and the sand and gravel segment reflects that.
The leading sand and gravel states — California, Texas, Minnesota, Arizona, and Nevada — show a different geographic pattern than crushed stone, reflecting the concentration of housing and commercial development in those markets. The five leading states alone produced 94.8 million metric tons in Q2 2026, an increase of 16.1 percent compared with the same period in 2025. That is a substantial jump, and it suggests that in specific markets, sand and gravel demand is recovering faster than the national average implies.
For a sand and gravel producer, the equipment considerations are different from those in crushed stone. Sand and gravel circuits typically involve washing and classification, and a recovery in demand puts pressure on screens, washers, and fines recovery systems. A plant that was producing acceptable product at 60 percent capacity may find that its screens cannot handle the volume at 80 percent, or that its water recycling system cannot keep pace with the increased throughput.
What Recovery Means for the Equipment You Already Own
A recovering market does not automatically reward every producer. It rewards the ones whose plants can run at higher utilisation without breaking down. The past six quarters of decline masked a lot of equipment problems. Crushers that needed new liners kept running because the plant was not running at full capacity anyway. Screens that were blinding kept producing enough because the throughput requirement was lower. Conveyors that were worn kept moving material because the volume was reduced.
When demand returns, those deferred problems become visible. A jaw crusher running at 90 percent of its rated capacity with worn plates will drop to 75 percent after a liner change that was postponed too long. A cone crusher with a cavity that was adequate for a lower throughput requirement may produce inconsistent product when pushed harder. A screen that blinded occasionally during the slow period will blind every shift when the feed rate increases.
The practical response is not to replace every piece of equipment. It is to identify the bottlenecks that will limit throughput as demand recovers, and address those first. In most crushing circuits, that means looking at the wear parts first, because they are the least expensive intervention with the most immediate effect on capacity.
The Wear Parts Question That Every Producer Faces in a Recovery
Wear parts are the most common bottleneck in a recovering plant, and they are also the easiest to overlook because they do not fail all at once. A jaw plate that has worn to 60 percent of its original thickness still crushes rock. It just does it less efficiently, at lower throughput, with more power consumption and a coarser product. The plant still runs. The numbers just get worse.
For crushed stone producers running granite, traprock, or other abrasive materials, the wear parts specification matters more during a recovery than it did during the downturn. A high-manganese jaw plate that was adequate at low utilisation may wear through faster when the crusher runs continuously. A cone liner that lasted six months at 60 percent capacity may last four months at 85 percent. The cost per tonne calculation changes, and so does the calculation of whether a premium liner grade is worth the additional upfront cost.
OCP Mechanical Company manufactures jaw crusher wear parts, cone crusher mantles and bowl liners, blow bars, and screen panels for aggregate and mining circuits. We supply Mn18Cr2, Mn22Cr2, and high-chrome grades, and because we sell direct from our factory, there is no distributor margin in the price. For a producer who is coming out of a slow period and wants to address wear parts before they become a bottleneck, that is a conversation worth having.
Regional Differences That Matter More Than the National Number
The national 5 percent increase is useful context, but it does not describe what is happening in any specific market. The states that led the recovery — Texas, California, Florida, Pennsylvania — are not the same states that led the sand and gravel segment. A producer in one of the leading crushed stone states may be seeing a different demand pattern than a producer in a state where the recovery is weaker.
The data shows that production increased in 33 of 41 states for which estimates were made. That means eight states did not see an increase. If you are operating in one of those eight, the national recovery headline does not describe your situation. If you are in one of the leading states, the demand is real, and the question is whether your plant can meet it.
The same logic applies to the type of material. Crushed stone and sand and gravel are recovering at different rates because they serve different end markets. A producer who supplies both should be looking at the demand signals in each segment separately, not assuming that one recovery applies to both.
How OCP Mechanical Company Supports Producers Through the Cycle
OCP Mechanical Company has manufactured mining and crushing equipment for over 40 years. We supply jaw crushers, cone crushers, impact crushers, VSI sand making machines, vibrating screens, feeders, sand washers, and complete crushing and screening plants. Every machine is new. We also supply the wear parts that keep those machines running — jaw plates, cone liners, blow bars, and screen media.
For aggregate producers who are seeing demand recover and want to make sure their plant can meet it, our engineering team can review your circuit, identify the bottlenecks that will limit throughput, and recommend the equipment or wear part changes that will address them. Because we sell direct from our factory, there is no distributor margin in the price, and our technical team works with you on the configuration rather than handing over a catalogue.
Our online customer service team is available 24 hours a day to discuss specifications, provide updated pricing, and help you work out what your plant actually needs. If you are evaluating your crushing circuit in light of the Q3 recovery, click the chat button and start the conversation.
All price information provided is for reference only; final quotes depend on equipment configuration, shipping terms, optional features, and current exchange rates. Product specifications are continuously updated; please consult our online customer service for the latest parameters tailored to your application.
-
Metso Launches LT400RS and LT200HPX All-Electric Mobile Crushers
-
China's Sand and Gravel Demand Confirmed in Retreat, Falling from 18.1 Billion to 12.7 Billion Tons
-
-
-
Global Crushing Equipment Market to Reach USD 15.44 Billion by 2035